
2022 CEO Pay Ratio Among S&P 500 Companies
Share
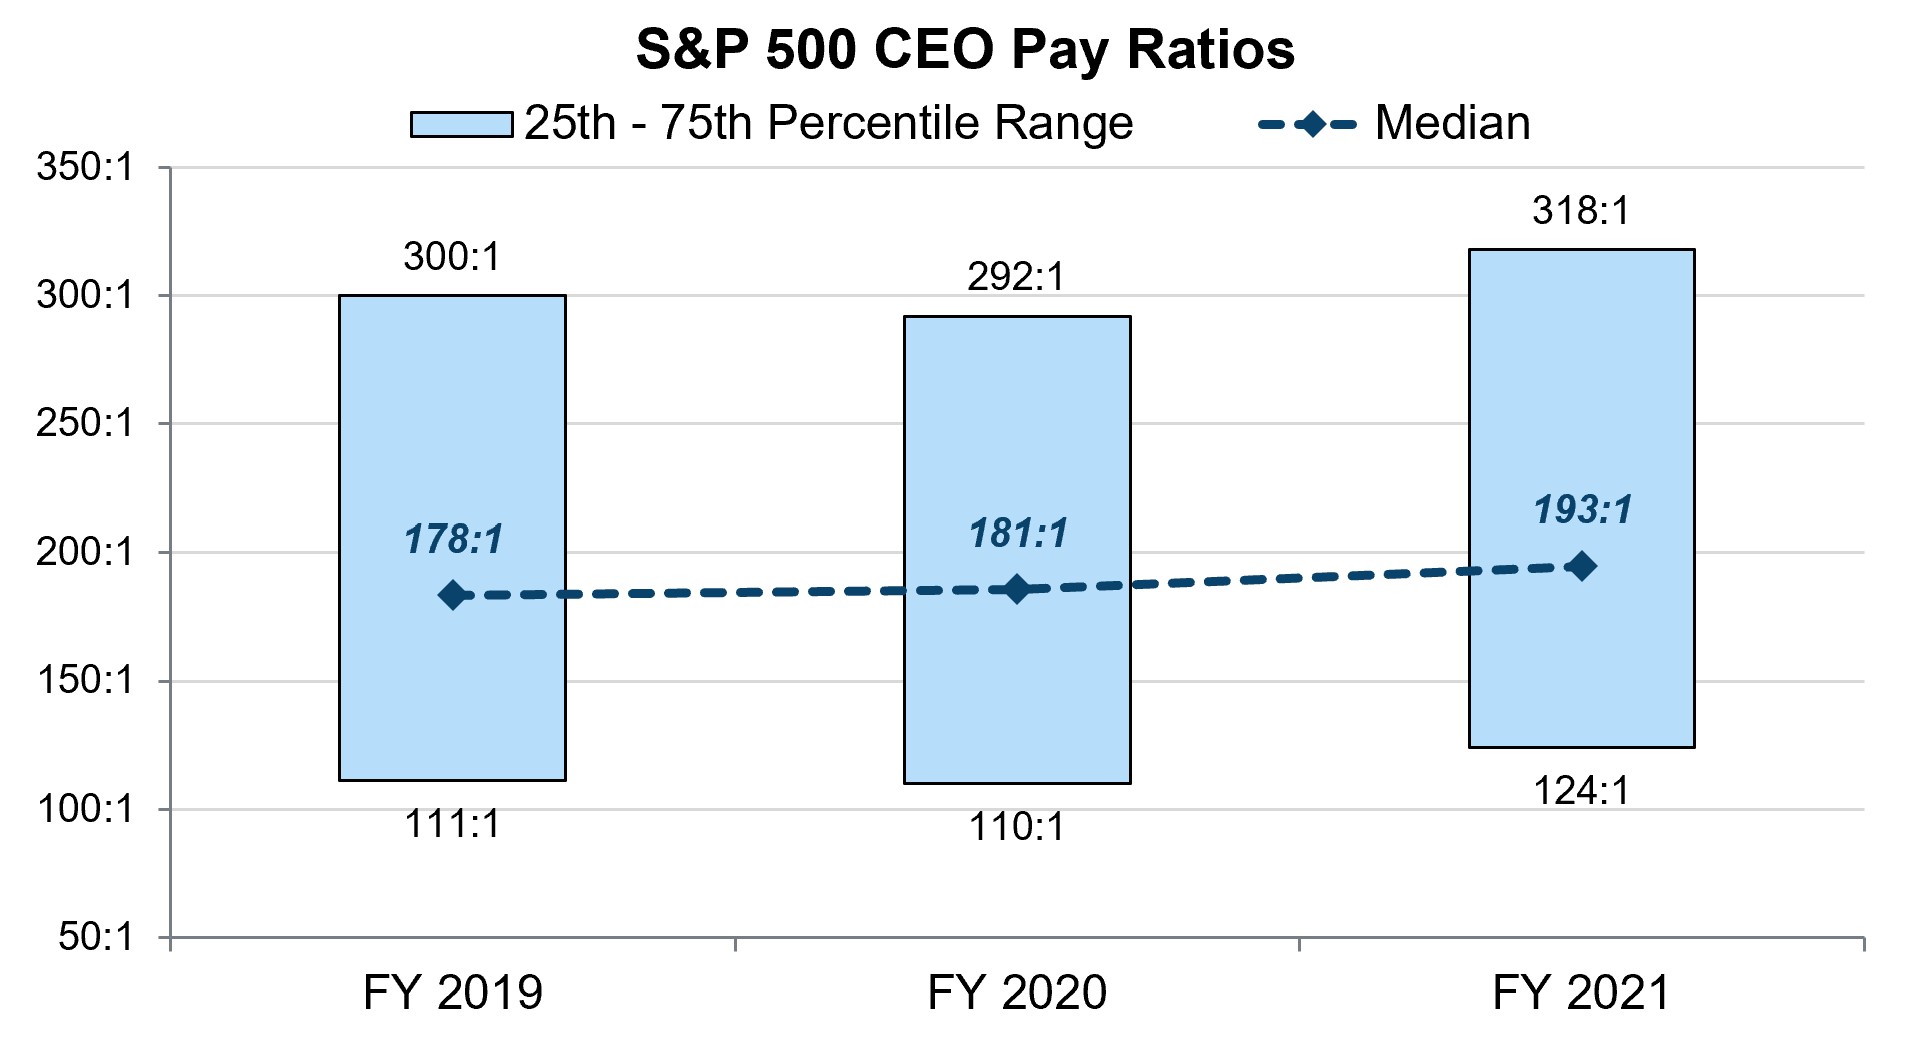
For the most recently reported fiscal year (2021), median CEO pay ratio for S&P 500 companies was 193:1, up from 181:1 for fiscal 2020, and 178:1 for fiscal 2019. Amazon reported the largest CEO pay ratio of 6,474:1, while the smallest was Tesla at 0 (in 2021, no compensation was reported in the summary compensation table of the proxy statement for Tesla CEO Elon Musk). From fiscal 2019 to 2021, median CEO pay used for the pay ratio calculation increased from $13.1 million to $14.4 million (+9.6%), while median employee pay has increased from $68,030 to $72,046 (+5.9%).
Our analysis includes investigating the correlation between CEO pay ratios and multiple size measures of companies (i.e., total revenue, market capitalization, assets, and employee headcount). The findings indicate employee headcount has the strongest correlation with CEO pay ratios; that is, companies with more employees tend to report higher CEO pay ratios.
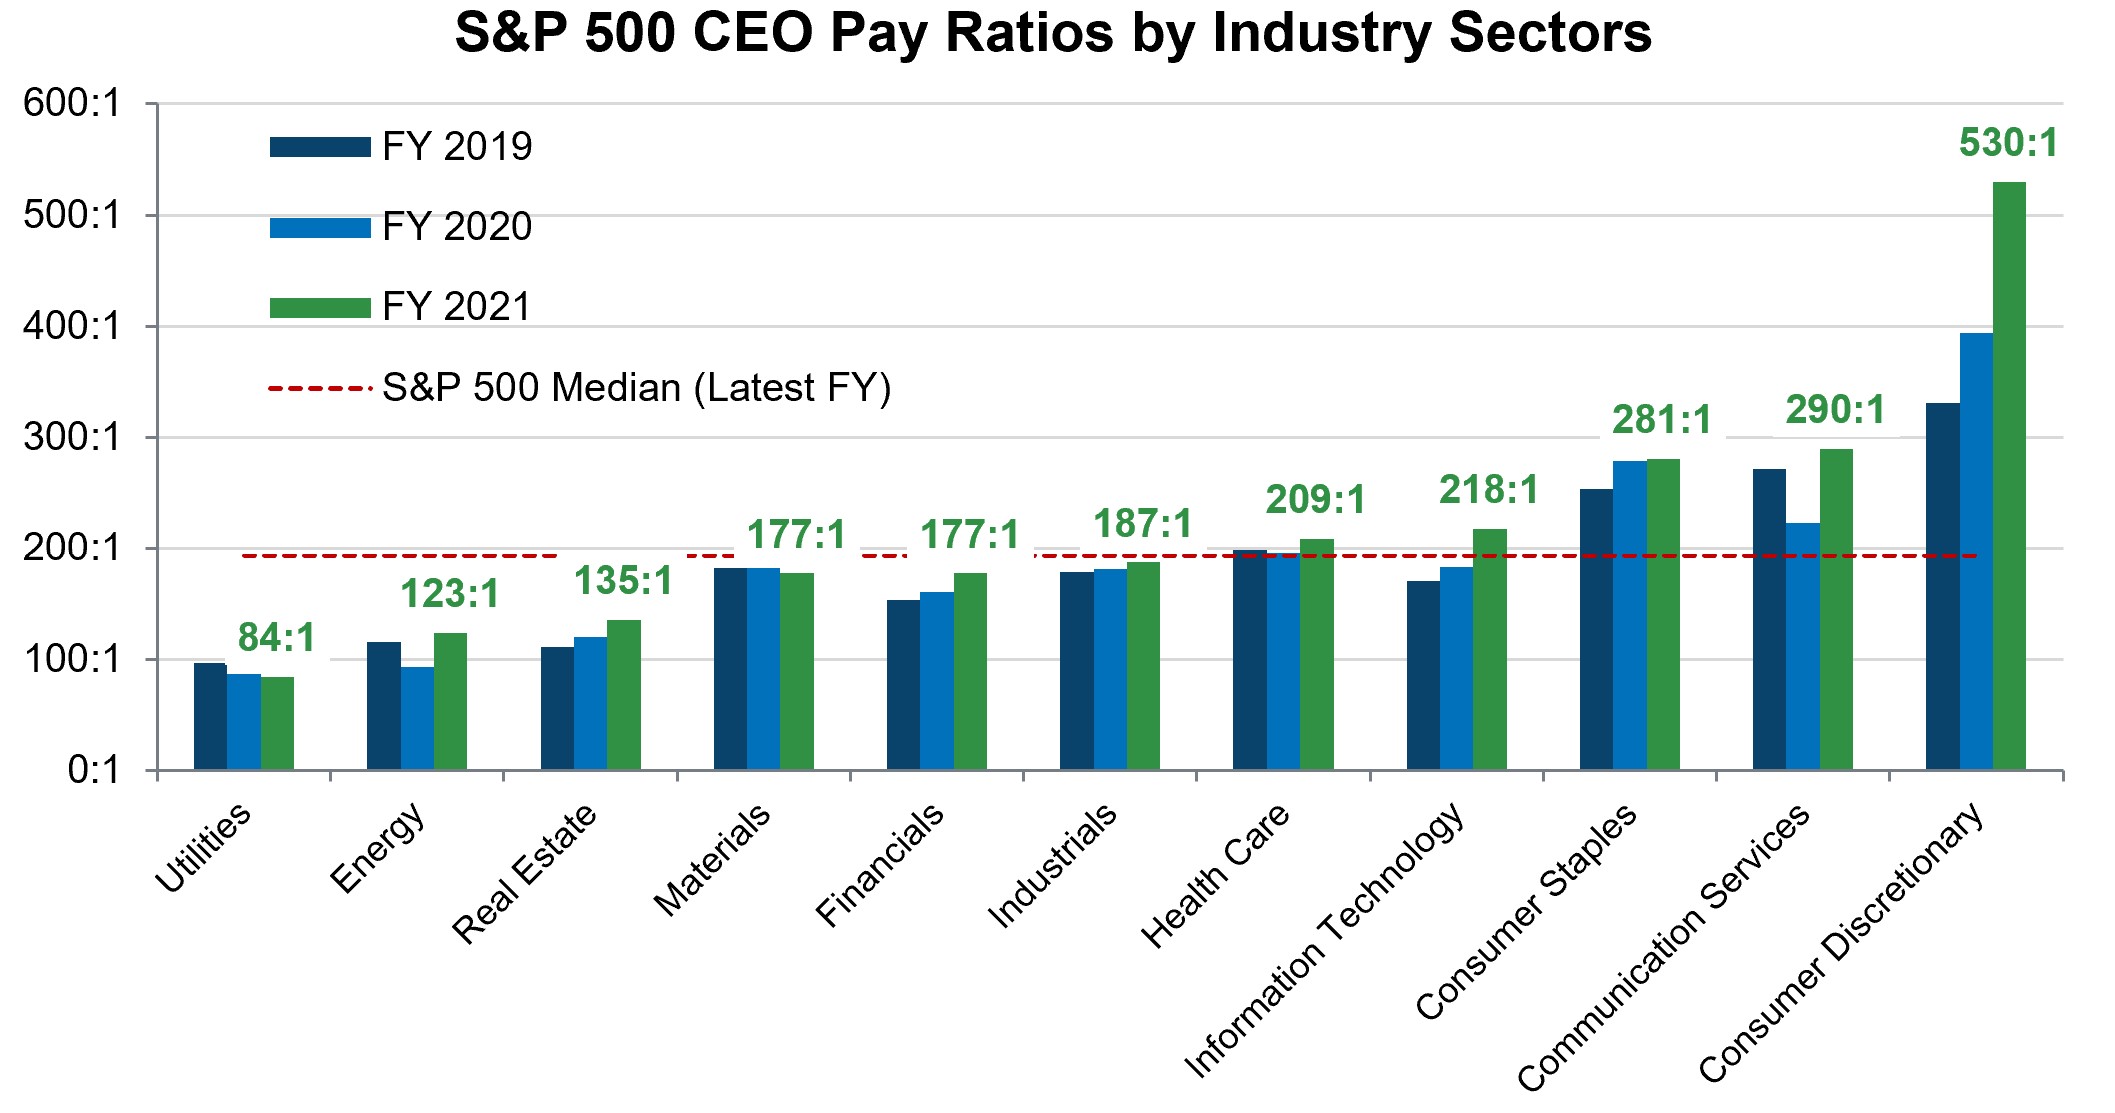
CEO Pay Ratios by Industry Sectors
The Consumer Discretionary industry, which includes car manufactures, consumer goods, hotels, luxury goods, restaurants, and retailers, reported the highest CEO pay ratios in each of the last three fiscal years, followed by Communication Services, and Consumer Staples. The Utilities industry reported the lowest CEO pay ratios in each of the last three fiscal years, followed by Energy and Real Estate industries. These findings are less an indication of relatively high or low CEO pay, and more an indication of prevailing pay rates among employees in each industry. For example, companies with many part-time, hourly workers tend to have higher pay ratios than companies with mostly full-time, salaried employees.
 Observations
Although the SEC intended for CEO pay ratio disclosure to provide public shareholders with another tool to evaluate CEO compensation relative to the median employee, in practice, the rules for calculating these ratios make it difficult to compare ratios across different industry sectors. Pay ratios reported by a company can experience significant variation year-over-year primarily driven by non-recurring compensation elements (i.e., one-time equity awards intended to cover multiple years of long-term incentives or sign-on payments). For example, in fiscal 2021, Amazon’s CEO received a large, front-loaded equity award with a grant-date fair value of $211 million that will vest over 10 years, with most of the shares vesting in years five through ten. If the front-loaded award were annualized over the 10-year vesting period, Amazon’s CEO pay ratio would be 554:1 rather than 6,474:1. Further, SEC rules allow each company to adopt a variety of methodologies to calculate their median employee pay (e.g., apply certain exclusions, make estimates and assumptions that are appropriate to each company’s practices, etc.), and thus, comparing pay ratios to other companies is rarely an apples-to-apples comparison.
CEO pay ratio data sourced from S&P Capital IQ Pro.
 Tyler Janney
Consultant
Tyler Janney’s consulting engagements focus on all aspects of executive and board compensation and he engages with clients, both public and private, in numerous industries and throughout various stages of the business cycle. Tyler specializes in executive compensation trends, annual and long-term incentive program design, peer group development, and the relationship between executive pay and company performance. In 2020, Tyler has supported the firm’s internal COVID-19 compensation adjustment updates.
 James Lutz
Consultant
James Lutz works with a variety of clients, with prior in-house compensation experience in the financial services industry. He provides a range of consulting services, including director compensation analysis, benchmarking and annual and long-term incentive program design.