
Equity Awards Using a Relative Total Shareholder Return Metric May Be Worth Significantly More or Less Than You Think, Which Will Impact Next Year’s Pay Versus Performance Table
By David Gordon, Kenneth H. Sparling, Andrew R. Lash
Share
This blog follows up on our recent alert (the “Alert”) summarizing the new SEC rule generally requiring that a pay versus performance (PVP) table be added to proxy statements for fiscal years ending after December 15, 2022.1 It presents a table constructed by Infinite Equity2 (with input from us) that may be of some interest to companies that issue long-term equity awards where the performance metric is relative total shareholder return (rTSR). Companies often estimate the value of “in-flight” awards (awards partway through the performance period) by using the "Intrinsic Value method,” which estimates value by determining a payout percentage based on the current percentile ranking and then multiplying that payout by the current stock price.
It turns out that in many cases the Intrinsic Value method produces a value quite different from the “Fair Value,” which is the value used for accounting purposes and required for the PVP table. The difference is most acute for awards tracking at no payout, where the valuation required for the PVP table can produce valuations near target payout in some cases.
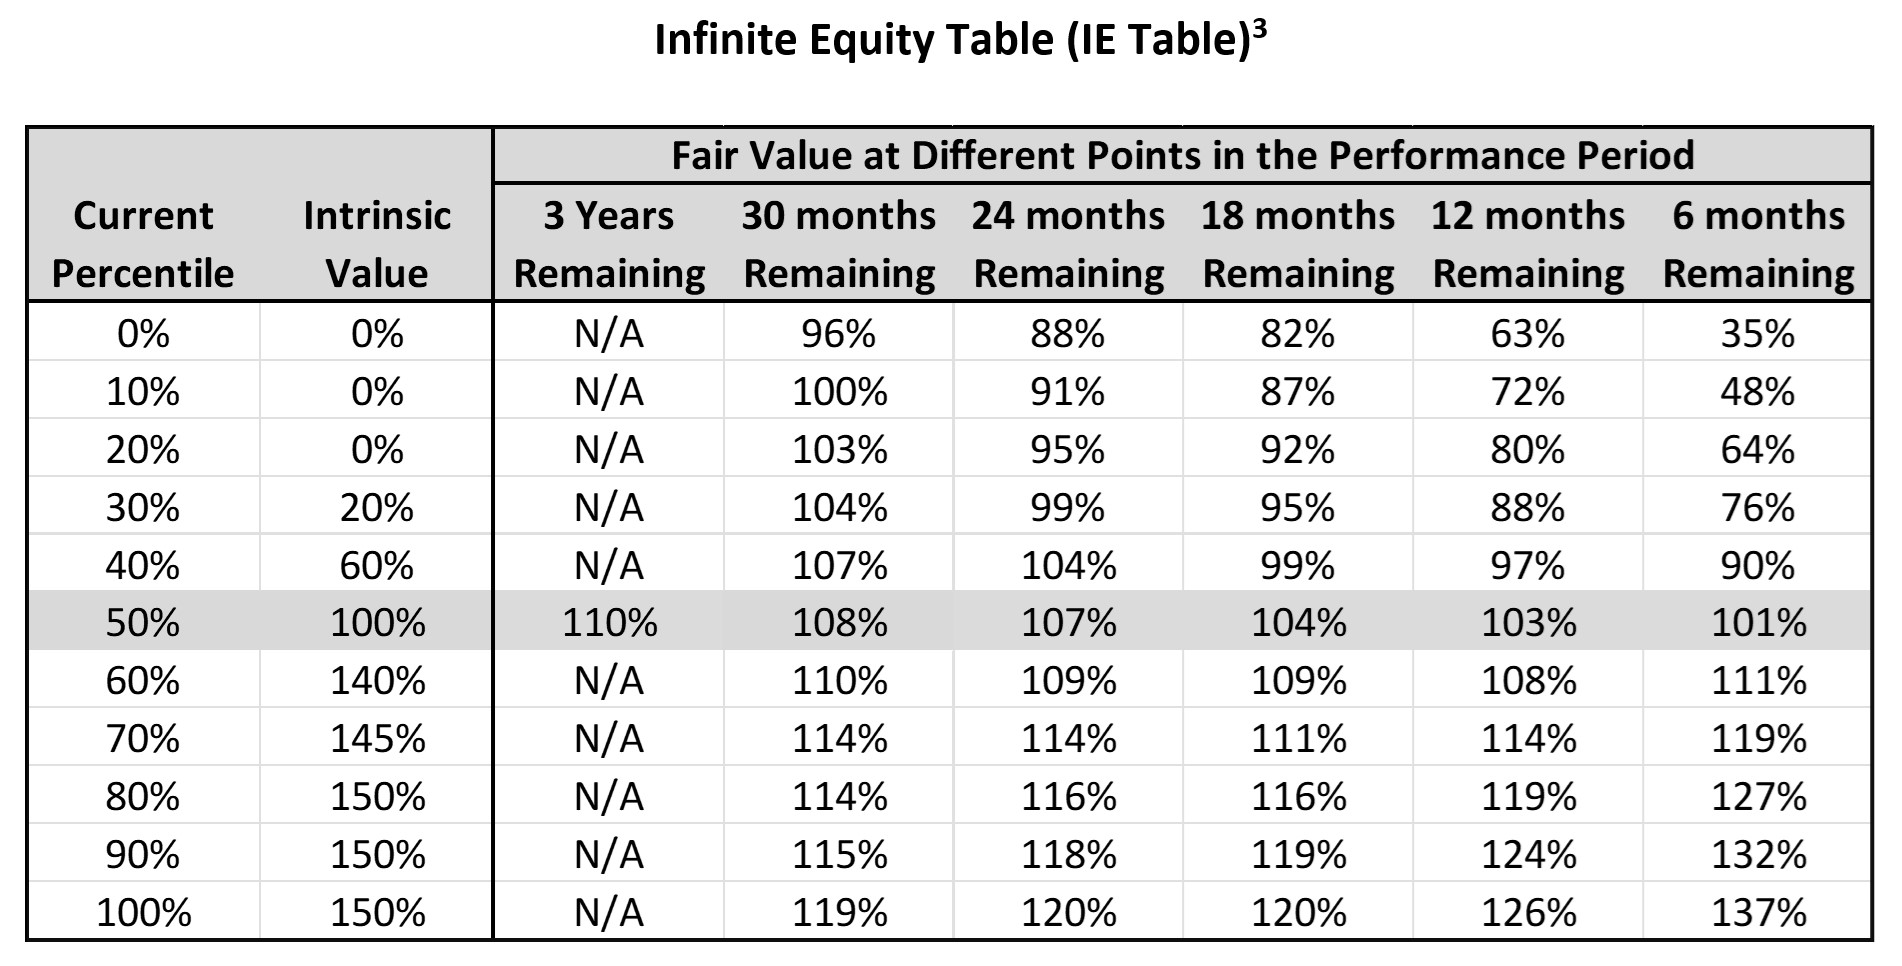
Here’s the table prepared by Infinite Equity. Exactly how it works is going to require a little explanation, but it makes sense to show the table at the outset.
The Intrinsic Value method is quite different than the Fair Value method, which latter method generally requires a Monte Carlo simulation. The Fair Value method computes the value by running thousands of computations simulating different price and total shareholder return paths that might be taken by the company’ stock and the peer group stocks, and then computing a value for the equity award by averaging the results. One can debate the perceived accuracy/wisdom of Monte Carlo valuations, but this type of valuation is required for rTSR awards in the new PVP table.
As explained in the Alert, the most complex aspect of the new PVP table will be new and complex calculations involving equity awards. For the 2023 proxy statement, the PVP table will compute something called Compensation Actually Paid (CAP) for the principal executive officer (PEO) individually and for the other NEOs as a group. The CAP values will generally be computed for 2020, 2021, and 2022. The CAP value is computed by starting with the Summary Compensation Table (SCT) value for total compensation, subtracting the values in the SCT for stock and option awards, and adding new equity values.4
For a particular year the new equity number for the PEO (the NEO computations are done the same way) computes the value of the PEO’s equity awards at the start of the year (which is equal to $0 if issued during the year) and compares them to the value at the end of the year or, if earlier, the date when the award is vested or forfeited. For example, suppose the company grants rTSR equity awards each March 1 that cliff vest at the end of three years based on the relative performance of the company against a peer group. In this case, you would need the following computations:5
- The 12/31/19 value of the rTSRs issued 3/1/17, 3/1/18, and 3/1/19.
- The 12/31/20 value of the rTSRs issued 3/1/18, 3/1/19, and 3/1/20.
- The 12/31/21 value of the rTSRs issued 3/1/19, 3/1/20, and 3/1/21.
- The 12/31/22 value of the rTSRs issued 3/1/20, 3/1/21, and 3/1/22.
An example illustrates why these computations are complex. Assume the common rTSR formula of target payout for 50th percentile ranking, 50% payout for 25th percentile ranking (and no payout below 25th percentile), and 150% payout for 75th percentile and above ranking, with linear interpolation between results. So, a grant of 1,000 restricted stock units (RSUs) with an initial stock price of $100, would result in final payouts of $50,000, $100,000, and $150,000, if the final ranking was 25th, 50th, or 75th percentile and the stock price was unchanged.
The new PVP table now requires 12 in-flight valuations. For example, let’s take the 12/31/19 computation and assume we are looking at the rTSR awards issued 3/1/18. Maybe 1,000 RSUs were issued when the stock price was $80, and the stock price is now $100. Finally, assume rTSR is tracking at the 30th percentile, which would indicate a 60% payout. What is the current value of the award?
As previously indicated, based on our experience, we think most companies estimate using the Intrinsic Value method, which estimates the value as $60,000. They would get this number by multiplying 1,000 RSUs times a 60% payout factor times $100.
The IE Table results in a significantly higher value. As of 12/31/19 an equity award issued 3/1/18 has 14 remaining months before it vests 3/1/21. The table has a value of 88% for awards with 12 months remaining and 95% for 18 months. The percentage obtained by interpolation is 90.33%, indicating a value of $90,333 (1,000 RSUs times $100 times 90.33%), over 50% higher than the Intrinsic Value method.
Three factors account for the higher adjustment factor. First, Monte Carlo modeling results in percentile rankings reverting toward the mean. Stated differently, a company that currently has a low percentile ranking has more upside opportunity and is expected to rise toward the 50th percentile, while a company that currently has a high ranking has more downside risk and is expected to drop toward the 50th percentile. Second, stock prices are expected to increase over time, so a 30th percentile ranking is worth more in the future than today because the underlying stock price is expected to increase on average. Third, there is a multiplicative effect for simulations in the modeling for above-target payouts, because strong relative performance is often accompanied by a higher stock price.
The IE Table also shows how values may be overestimated in the case of a company with a high current rTSR ranking. For example, if the company were tracking at the 70th percentile, the Intrinsic Value method yields a payout factor of 140%. If there were 18 months left in the award, the estimated Fair Value (from the IE Table) would be 111%, or about 20% less.
There are a number of assumptions built into the construction of this table, all of which should be noted:
- The 50% to 150% leverage curve (based on 50th to 75th percentile ranking) is relatively moderate. A steeper leverage curve, for example, 50% to 200% leverage based on 50th to 90th percentile ranking, would lead to more pronounced divergence between the Intrinsic Value method and the Monte Carlo value when a company is performing below target.6
- The peer group is composed of 20 peers. A larger peer group would likely lead to slightly more convergent values between Intrinsic Value and Fair Value.
- The company’s stock is assumed to have a 40% volatility. Higher volatility would generally produce greater Monte Carlo values and thus more overall value. This could yield greater convergence with the Intrinsic Value method for above-target performers, but greater divergence for below-target performers.
- There is an assumed correlation coefficient of .50 between the performance of the company and the peer companies. In general, a higher correlation coefficient would yield lower Monte Carlo values and a lower correlation coefficient would yield higher Monte Carlo values. In both cases, the divergence of results between methods likely becomes greater for companies performing above or below target.
As companies develop estimates for CAP for their 2023 proxy statements, we believe that a table like this can be a reasonable placeholder for estimated Fair Values (at least until the end of the year when a final Monte Carlo simulation to determine Fair Value will be required). Although the table reflects a specific set of assumptions, so that results may diverge for some plan designs, we think it is still a useful tool for companies that would like to develop insight into their 2023 PVP table and have not yet started full valuations.7 The table may be particularly helpful in cases where current percentile rankings are extremely high or low and there is significant time for the awards to run since this is where the divergence between Intrinsic Value and Fair Value is the greatest.
1 See “SEC Finalizes Pay Versus Performance (PVP) Rule, Requiring Complex Calculations for 2023.” This blog assumes some familiarity with the SEC rule, as summarized in the Alert.
2 Infinite Equity is a firm specializing in valuation of equity awards and related issues. https://infiniteequity.com/
3 Assumes 40% stock price volatility, 20 performance peers, and correlation coefficient of 0.5 between the subject company and its peers.
4 Additional changes are required if the company maintains a pension plan. As described in the Alert, there may also be a need to take into account dividends paid on the equity if they are currently distributed to the executive.
5 Of course, you will need the value of these equity awards on their vesting dates, but since the company will already need to compute the value of the awards at this point for purposes of the Option Exercises and Stock Vested Table, this computation introduces no additional complexity.
6 In general, one way to improve the accuracy of the table is to compare the grant date value of the award to the 110% grant date value in the IE Table. So, if the award in question had a grant date value of 115%, for example, the tabular values could be multiplied by 115/110.
7 FW Cook does not perform the type of Monte Carlo valuations described in this blog. Based on conversations with Infinite Equity, our understanding is that computation of the 12 valuations necessary for a company with three outstanding rTSR RSU cycles, depending on a number of factors, can cost somewhere in the range of $20,000 to $50,000.
 David Gordon
Managing Director
Dave Gordon’s practice as an executive compensation consultant covers a variety of industries, including extensive experience with financial institutions and utilities. Based on his years of experience as an executive compensation lawyer, he acts as the senior resource on numerous technical issues for the Firm. He frequently acts as an expert witness.
 Kenneth H. Sparling
Managing Director
Ken Sparling’s assignments have been with both public and privately-held companies in various industries. His consulting engagements focus on all aspects of executive and board compensation including annual and long-term incentive programs, employment agreements and change-in-control arrangements.
 Andrew R. Lash
Consultant
Andrew Lash works with public and private companies across a variety of industries, consulting on executive and non-employee director pay practices and compensation program considerations in general.