
Holding Power: S&P 500 Snapshot
By Andrew R. Lash, Shashwat Singh
Share
Background
We reviewed broad-market data using S&P 500 executives to support preliminary assessments of executive Holding Power (aka retention glue). Despite a cooldown in the broader labor force, Compensation Committees are well served to understand the depth of their retention hooks on key executives, for whom the talent market remains fluid.
Holding Power expresses the intrinsic value of unvested equity* that an executive has “at risk” and is often viewed as a multiple of salary, long-term incentive (LTI) grant value, and/or target total direct compensation (TDC). We define TDC as the sum of salary, target bonus, and LTI grant value.
Absent “perfect” succession planning, the loss of key talent is at best distracting and at worst disruptive to business operations. While no Committee can guarantee with absolute certainty that leaders will not be poached, periodically reviewing Holding Power enables proactive, informed decisions instead of reactive and costlier ones down the line. And unless managed carefully, costs incurred to onboard a replacement may prompt scrutiny from investors and proxy advisors, place undue pressure on equity budgets (absent use of inducement-plan shares), and create internal tension if remaining executives do not fully appreciate the dollars spent to entice a new hire. For these reasons, a review of Holding Power multiples is a prudent component of the annual compensation planning cycle and supports good governance.
The Data
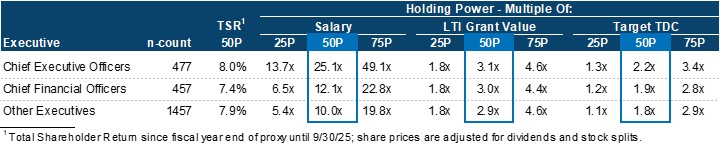
We sourced executive-by-executive equity holdings data for the members of the S&P 500 (as of 7/15/25) using each company’s proxy-disclosed Outstanding Equity Awards table. All equity is valued as of 9/30/25 so that each company is broadly affected by the same market realities, with individual compensation levels as of the same fiscal year end. Holding Power multiples were individually arrayed and categorized based on salary, LTI grant value, and target TDC for CEOs, CFOs, and other Named Executive Officers (i.e., “top-five” executives excluding non-CEO Executive Chairs).
CEOs have the highest levels of Holding Power, with a median multiple of 2.2x target TDC and a 25th to 75th percentile range of 1.3x to 3.4x target TDC. CFO levels are not meaningfully different from other non-CEO/CFO executives; both cohorts show median multiples of target TDC just under 2x. CEO multiples are typically higher because equity makes up a larger portion of their total annual pay package – this is most evident when multiples are viewed relative to salary.
For context, the median absolute Total Shareholder Return (TSR) across cohorts was roughly +8% since the end of each company’s last fiscal year, indicating that these multiples reflect a modestly positive market environment.
Various assumptions were made to normalize the data. The analysis assumes that performance-based equity is tracking to pay out at 100% of target, which may understate or overstate the S&P 500’s constituents’ true Holding Power levels. Other assumptions include but are not limited to: excluding executives that did not receive equity grants in the year of the proxy; including the annualized value of “special awards” only when granted in year of the proxy; and including founders and newly hired executive so as not to overengineer the data set.
Other Considerations and Takeaways
More meaningful comparisons of Holding Power come from benchmarking against executive compensation peer groups, since the output is sensitive to several factors: market and company performance (with higher returns and above-target payout estimates boosting Holding Power), the size and mix of equity awards (often correlated to market capitalization), and specific industry practices. For instance, high-growth sectors such as technology and life sciences generally rely more heavily on equity compensation and stock options, which offer additional leverage and potential for greater multiples when share prices rise. Because of these dynamics, Holding Power is best interpreted relative to target TDC and through the lens of peers facing similar market and industry conditions.
Below-median multiples should not be viewed as an automatic red flag; factors like short tenure or recent promotion can naturally depress an executive’s unvested holdings. Instead, treat the data as a guidepost that indicates whether an executive’s Holding Power appears below, in-line, or above market norms, and discuss whether action is warranted. While high unvested holdings do not guarantee retention, periodic reviews can help Committees lessen the risk of unforeseen and costly departures.
* We focus on equity for simplicity, though forfeitable long-term cash awards are also appropriate to include in Holding Power analyses, as they also work to keep executives in their seats.
 Andrew R. Lash
Consultant
Andrew Lash works with public and private companies across a variety of industries, consulting on executive and non-employee director pay practices and compensation program considerations in general.
 Shashwat Singh
Consultant
Shashwat Singh consults on executive and board compensation, with experience across a range of industries and stages of growth in both the for- and non-profit sectors. His work includes a focus on total compensation and incentive program design, peer group analysis, governance, and pay-for-performance evaluations.