
Banking CEO Pay Ratios
By Edward D. Graskamp
Share
The CEO pay ratio disclosure, enacted in 2010 as part of the Dodd-Frank Act, is the executive compensation item getting the most attention this proxy season. Despite strong opposition on many fronts, the pay ratio lived to see the light of day and is included for the first time in 2018 proxy statements for companies with fiscal years starting on or after January 1, 2017 (Emerging Growth Companies and certain other issuers are exempted from the ratio disclosure). Although the focus of much commentary and analysis, the implications of this new piece of public information remain to be seen.
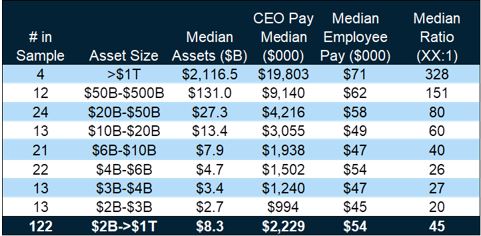
To provide a closer look at the pay ratio, we analyzed the CEO pay ratio disclosures of 122 banks with assets greater than $2 billion (as of the most recent fiscal quarter) that included pay ratio disclosures in proxy statements filed by April 11, 2018; we examined the disclosures by asset size and geography. (A summary of the sample banks by assets and geographic region is at the end of this blog.) Key findings of our analysis include the following:
Median Ratio of 45:1
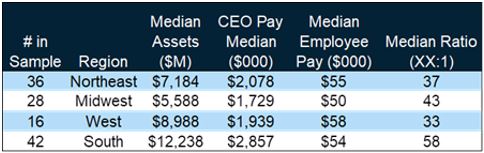
The median banking CEO pay ratio was 45:1, ranging from a high of 369:1 with the lowest being 10:1 (see Exhibit 1 for detail). The 75th and 25th percentiles varied about 71% above to 42% below the median (77:1 and 26:1, respectively). The South had the highest median CEO pay ratio at 58:1 and the highest median assets, while the West had the lowest pay ratio at 33:1.
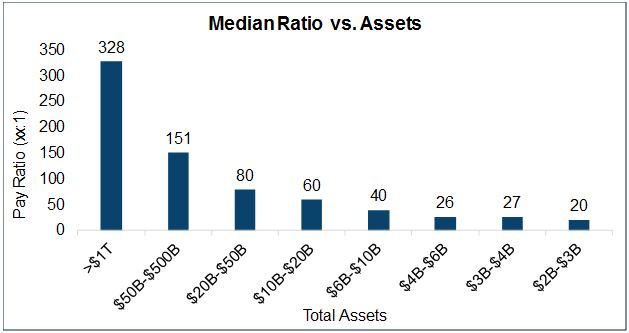
CEO Pay Ratio Positive Correlation with Asset Size
The CEO pay ratios positively aligned with asset size (64% correlation), which was also the case for CEO compensation (68% correlation). See Exhibit 2 for detail.
Little Variation in Median Pay by Size or Geography
There was no relationship between a bank’s asset size and median employee pay, which was $53,982 for all banks. Median employee pay varied somewhat throughout the country with an $8,000 difference between the lowest (Midwest at $49,592) and the highest (West at $57,559).
Exhibit 1
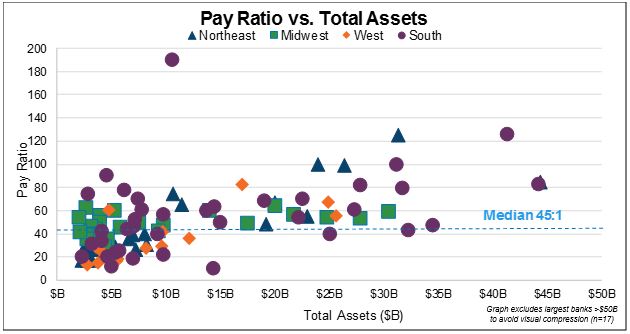
Exhibit 2
Sample Details – By Asset Size
Sample Details – By Geography
GICS analyzed to develop study: 40101010 & 40101015
Source: S&P Capital IQ Database
Download the Exhibits here.