
CEO Pay Ratios Among S&P 500 Companies
Share
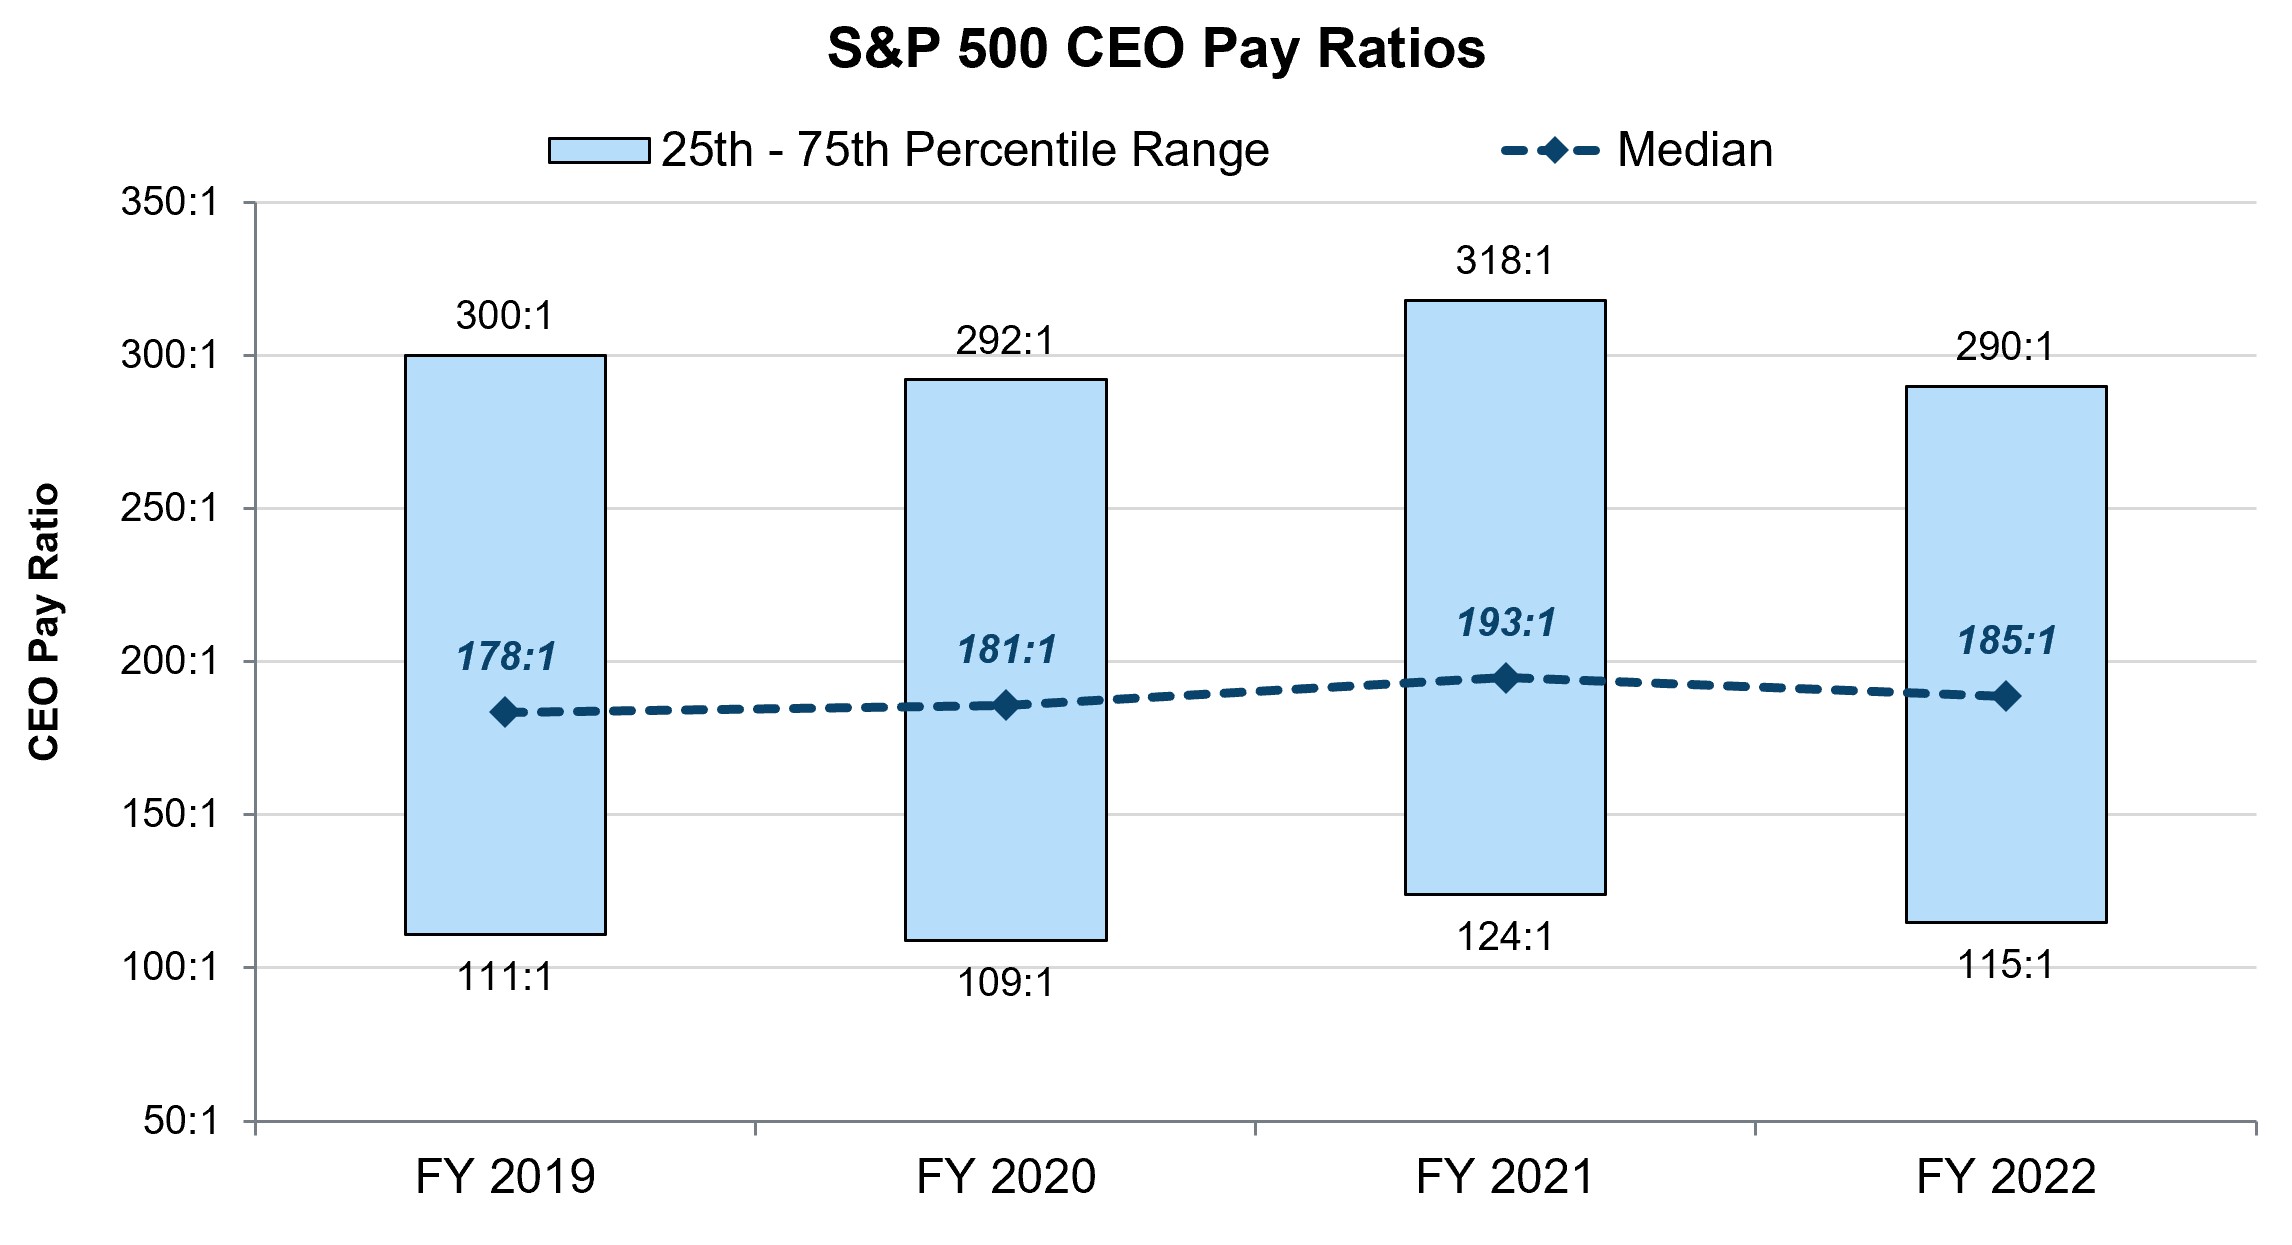
S&P 500 CEO Pay Ratio
For the most recently reported fiscal year (2022), the median CEO pay ratio for S&P 500 companies was 185:1, down from 193:1 for fiscal 2021, but up from 178:1 and 181:1 for fiscal years 2019 and 2020, respectively. The 25th and 75th percentile CEO pay ratios for fiscal 2022 also declined from the prior year, falling in line with fiscal year 2020 levels. The median CEO pay used for fiscal year 2022 pay ratio calculations decreased from $14.4 million to $14.2 million (-1.7%). From fiscal 2019 to 2022, this value increased from $13.1 million to $14.2 million (+7.9%). Similarly, median employee pay increased from $68,000 to $75,400 (+10.9%) over the same timeframe.
S&P 500 Median Employee and CEO Pay
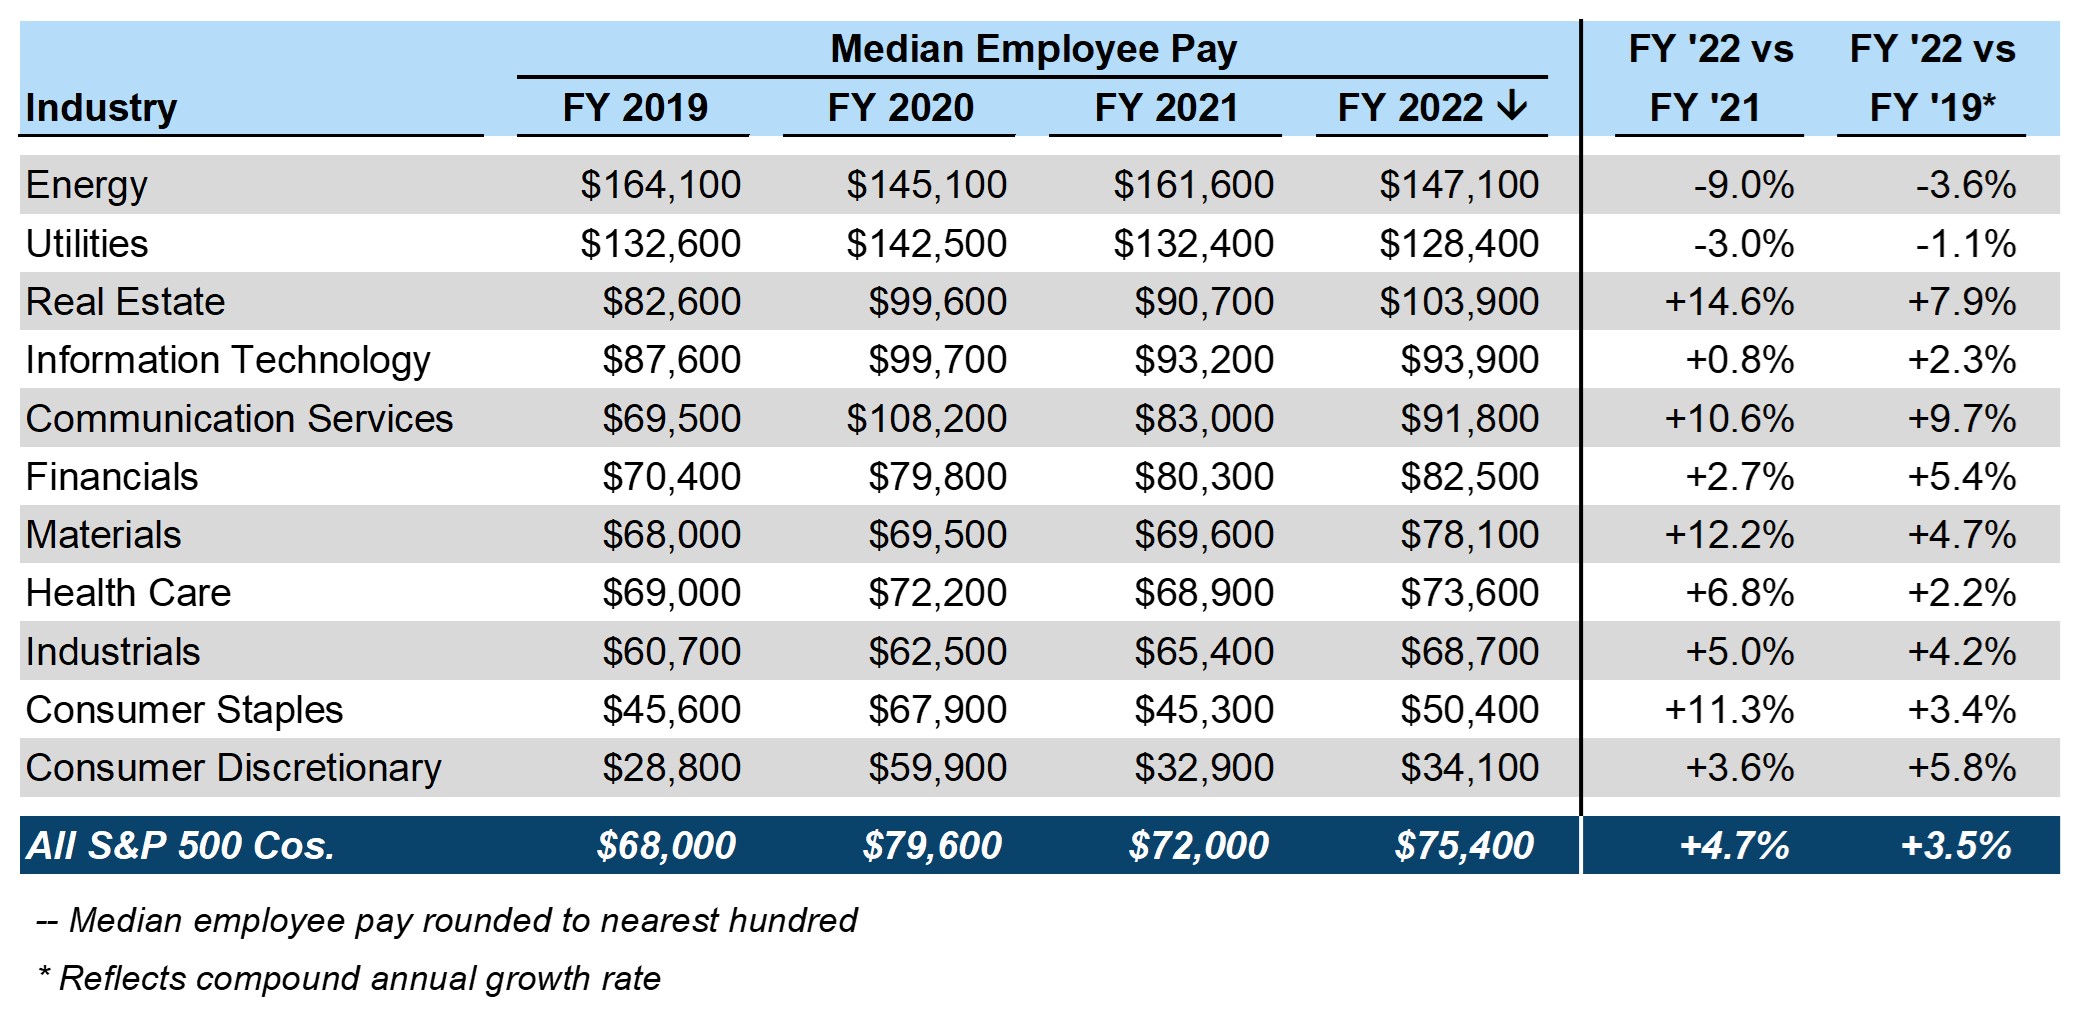
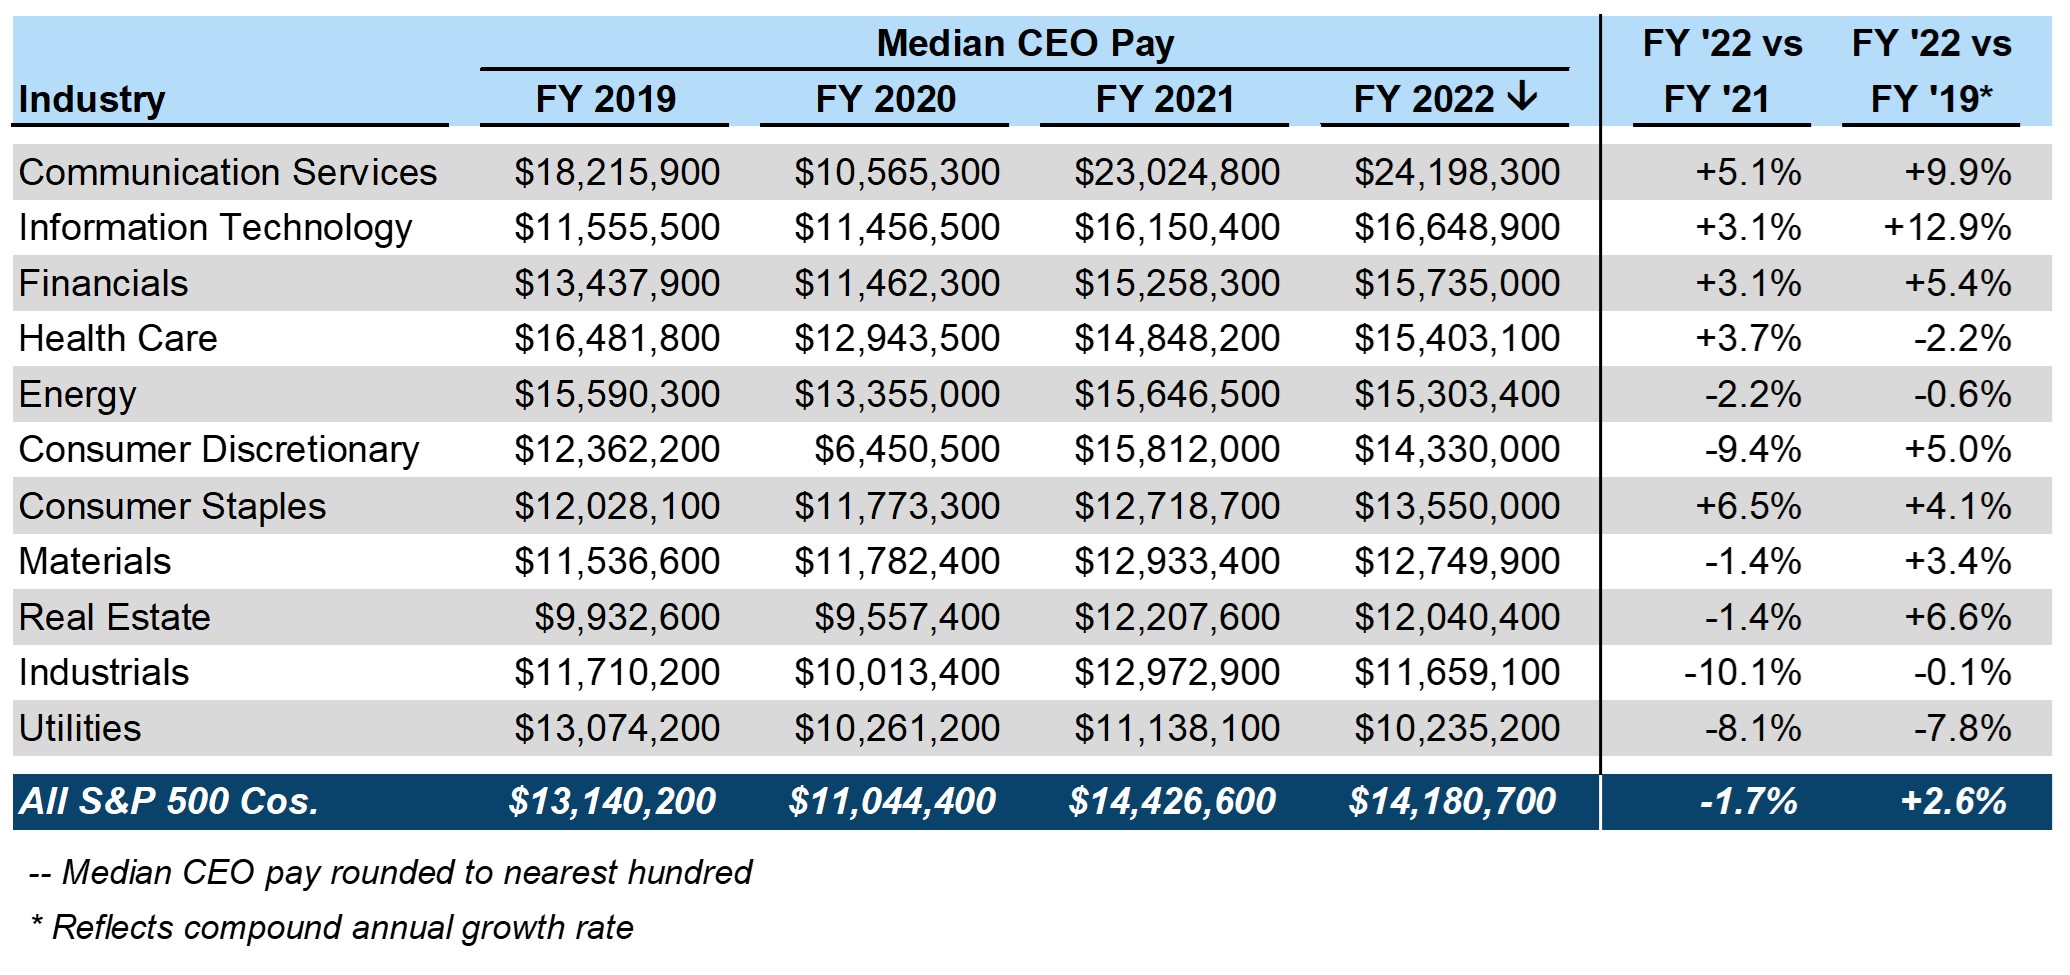
Among the S&P 500, pay values have generally trended upwards for median employees and CEOs, though differences between these two groups are present. Median employee pay increased by +4.7% from $72,000 in 2021 to $75,400 in 2022, which lagged the average U.S. core inflation rate of 6.2% in 2022 per the U.S. Bureau of Labor Statistics.1 In this same period, median CEO pay decreased by -1.7% from $14.4 million to $14.2 million. From 2019 to 2022, both median employee and CEO pay grew, at annual rates of +3.5% and +2.6%, respectively.
For median employees, Energy, Utilities, and Real Estate industries reported the highest median employee pay in each year since 2019 in terms of absolute dollars. In 2022, nine of 11 industries reported an increase in median employee pay compared to the year prior; the two industries with the highest median employee pay reported a decrease from 2021 to 2022 (Energy -9.0%; Utilities -3.0%). Four industries reported an increase of 10% or more in 2022 (Communication Services +10.6%, Consumer Staples +11.3%, Materials +12.2%, and Real Estate +14.6%).
In contrast, median CEO pay changes by industry reveal a different hierarchy. Communication Services, Information Technology, and Financials reported the highest 2022 pay, though these industries have been positioned lower in previous years (e.g., Information Technology was ninth in median CEO pay in 2019). Only five of the 11 industries saw an increase in median CEO pay from 2021 to 2022, with no industries reporting an increase of +10% or more. The largest increases compared to last year were seen in the Consumer Staples (+6.5%), Communications Services (+5.1%), and Health Care (+3.7%) industries.
S&P 500 CEO Pay Ratio by Industry Sector
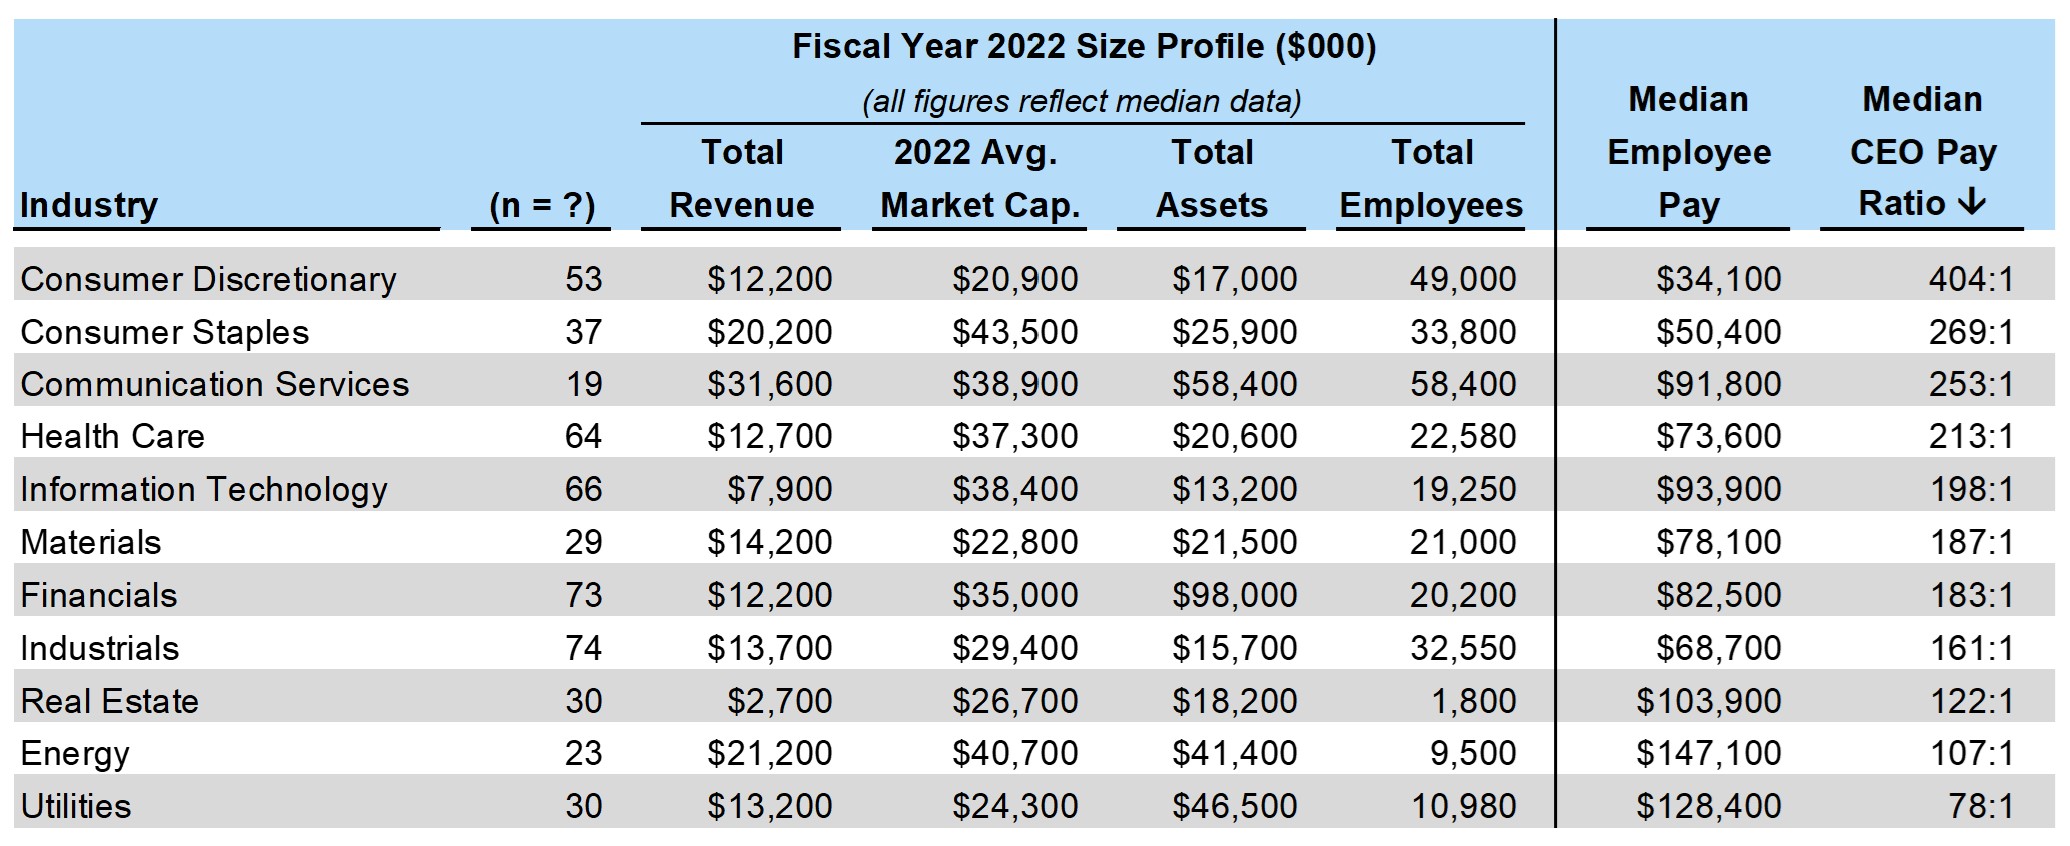
The Consumer Discretionary industry, which includes car manufacturers, consumer goods companies, hotels, luxury goods businesses, restaurants, and retailers, has reported the lowest median employee pay since 2019. Companies in this industry generally have 1) higher employee headcounts and 2) more part-time, hourly employees relative to other industries. Since the CEO pay ratio’s inception, employee headcount has shown the strongest correlation with larger CEO pay ratios.
Does CEO Pay Ratio Provide Useful Information?
The original intention of CEO Pay Ratio disclosure was that it would provide shareholders with useful information to evaluate the appropriateness of CEO compensation relative to the broader workforce. However, after five years of CEO pay ratio disclosure, the CEO pay ratio bears minimal weight in the context of decision-making with respect to CEO compensation. Similarly, the CEO pay ratio has not been used as a factor by proxy advisory firms in developing vote recommendations on “Say on Pay” (SOP), nor has it been a key consideration in large, institutional investor proxy voting policies.
One reason the CEO pay ratio has not had much impact is that rules for calculating the ratios make it difficult to compare them across companies. Pay ratios reported by a company can experience significant variation year-over-year, primarily driven by non-recurring compensation elements (i.e., one-time equity awards intended to cover multiple years of long-term incentives or sign-on payments). For example, Amazon’s CEO received a large, front-loaded equity award with a grant-date fair value of $211 million that will vest over 10 years, resulting in a CEO pay ratio of 6,474:1 based on a median employee pay of $33,000. In 2022, Amazon’s CEO pay ratio was 38:1, a fraction of its ratio in the year prior, and lower relative to other similar peer-like companies. Even for similarly sized companies in the same industry, CEO pay ratios can vary depending on a company’s human resources strategy: e.g., Which functions are outsourced versus internally staffed? What are market pay rates in geographies in which the company has employees? Does the company have a significant number of part-time versus full-time employees?
Last year, the SEC implemented another executive compensation disclosure requirement from the Dodd Frank Act: Pay Versus Performance (PvP). Like the CEO Pay Ratio disclosure, PvP disclosure was intended to help shareholders assess whether a company’s executive compensation programs produced pay outcomes that were aligned with company performance. The verdict is still out on whether the PvP disclosure will accomplish this objective. Like the CEO Pay Ratio, the PvP table disclosure is quite complex, difficult to interpret, and imperfect when comparing against other companies. ISS does not use the PvP information in its quantitative screen, but may consider it in its qualitative review process. As additional years of information are required to be disclosed in future proxy statements, along with further education and public awareness of the PvP table, opinions might change on the relevance of this disclosure. For now, we expect shareholders to take a similar stance on the PvP disclosure as they do on CEO pay ratio – because it is difficult to normalize across companies and industries, it is not a practical tool for effective compensation decision making.
CEO pay ratio data sourced from S&P Capital IQ Pro.
1 United States Core Inflation Rates (1957-2023) (usinflationcalculator.com)
 Tyler Janney
Consultant
Tyler Janney’s consulting engagements focus on all aspects of executive and board compensation and he engages with clients, both public and private, in numerous industries and throughout various stages of the business cycle. Tyler specializes in executive compensation trends, annual and long-term incentive program design, peer group development, and the relationship between executive pay and company performance. In 2020, Tyler has supported the firm’s internal COVID-19 compensation adjustment updates.
 James Lutz
Consultant
James Lutz works with a variety of clients, with prior in-house compensation experience in the financial services industry. He provides a range of consulting services, including director compensation analysis, benchmarking and annual and long-term incentive program design.